Railway station usage map shows disproportionate growth across the UK
Posted: 20 January 2016 | | 1 comment
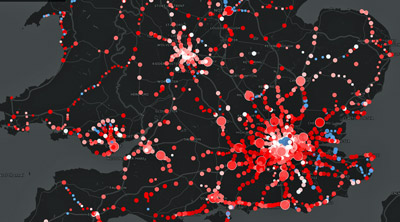
A new interactive railway station usage map launched by Campaign for Better Transport has revealed massive growth in passenger numbers in many areas but large regional disparities elsewhere. The interactive railway map shows recorded railway station usage of more than 2,500 railway stations in England Scotland and Wales over the past 17 years since 1997. […]


A new interactive railway station usage map launched by Campaign for Better Transport has revealed massive growth in passenger numbers in many areas but large regional disparities elsewhere.


The interactive railway map shows recorded railway station usage of more than 2,500 railway stations in England Scotland and Wales over the past 17 years since 1997.
Findings reveal that:
- In 2014/15, an estimated 2.75 billion entries and exits were recorded across the rail network – 1.45 billion more than in 1997/98
- There are now 686 stations which attract over one million entries and exits each year, compared with 215 in 1997/98
- Last year 85 stations attracted over five million journeys, compared with 22 in 1997/98.
Whilst passenger growth has been significant in many areas, the map also reveals the growth has been very uneven. Growth in London and the South East has been particularly strong for example, with London Waterloo seeing over 40 million more entries and exits than in 1997, whilst other areas, like Humberside, have been much weaker. Many regional cities have also seen a huge increase in passengers with Leeds station experiencing 18 million more entries and exits than in 1997 and Birmingham New Street experiencing 25 million more.
Railway station usage map shows 2.75 billion entries and exits were recorded across the rail network in 2014/15
The map also shows a number of lightly used stations, for example Gainsborough Central in Lincolnshire, which attracted 1,500 journeys in 2014/15 but only has services on Saturdays. Highlighting the potential of such stations the map reveals a number of similarly lightly used stations in 1997 are now thriving, including Needham Market in Suffolk, which has seen 13-fold increases in passengers, and Gowerton in Wales which has seen a 17-fold increase.
|
Station |
1997/98 passenger numbers |
2014/15 passenger numbers |
Percentage increase |
|
Gowerton |
5,890 |
110,076 |
1769 |
|
Dronfield |
9,637 |
162,474 |
1586 |
|
Needham Market |
6,259 |
91,358 |
1360 |
|
Whitlock’s End |
9,040 |
129,144 |
1329 |
|
Patchway |
6,507 |
90,404 |
1289
|
Andrew Allen, Policy Analyst at Campaign for Better Transport, said: “Overall the railways have grown very strongly in the last 20 years, but this map reveals just how uneven that growth has been. Investment has tended to focus on relieving overcrowding in south east England, while leaving other parts of the country in a time warp.
“Our mapping shows areas which are strong candidates for growth and where targeted investment in better services and even new stations could make a real difference. The government needs to be braver both in anticipating the potential for growth and in getting more places onto the network.”
Stay Connected with Global Railway Review — Subscribe for Free!
Get exclusive access to the latest rail industry insights from Global Railway Review — all tailored to your interests.
✅ Expert-Led Webinars – Gain insights from global industry leaders
✅ Weekly News & Reports – Rail project updates, thought leadership, and exclusive interviews
✅ Partner Innovations – Discover cutting-edge rail technologies
✅ Print/Digital Magazine – Enjoy two in-depth issues per year, packed with expert content
Choose the updates that matter most to you. Sign up now to stay informed, inspired, and connected — all for free!
Thank you for being part of our community. Let’s keep shaping the future of rail together!


I experience too much of Britain’s non-London area rail network as fairly useless because of early close-down of services after the afternoon peak. Living near Weston-S-M it makes use of the train for visiting theatres in Bristol or Taunton impossible and I know that elsewhere the same problem is encountered. If you have to use the car anyway, it is ancient public transport knowledge that the train gets overlooked for all other travel activities as well, never mind the ridiculous bus connections to and from Weston and other train stations here. The train could do so much better than even at present with more joined-up and customer-orientated thinking (remember that one?).