Achieving a successful GSM-R radio plan
Posted: 1 August 2008 | | No comments yet
Railways across Europe and in other parts of the world are replacing their analogue operational radio communications networks by a digital system called GSM-R. This is an enhanced version of the hugely successful public cellular radio standard, GSM (Global System for Mobile Communications) which has additional features to meet the specific requirements of Professional Mobile Radio (PMR) communications which include railway communications.
Railways across Europe and in other parts of the world are replacing their analogue operational radio communications networks by a digital system called GSM-R. This is an enhanced version of the hugely successful public cellular radio standard, GSM (Global System for Mobile Communications) which has additional features to meet the specific requirements of Professional Mobile Radio (PMR) communications which include railway communications.
Railways across Europe and in other parts of the world are replacing their analogue operational radio communications networks by a digital system called GSM-R. This is an enhanced version of the hugely successful public cellular radio standard, GSM (Global System for Mobile Communications) which has additional features to meet the specific requirements of Professional Mobile Radio (PMR) communications which include railway communications.
Anyone designing a radio plan for GSM-R needs to avoid the pitfall of assuming that the same rules and criteria can be applied as for a standard GSM network. The specific railway environment and the demanding requirements for operations mean that a new approach to radio planning is necessary. This becomes even more important once GSM-R is used in Europe as the radio bearer for the Train Control System (TCS).
Why GSM-R radio planning is different
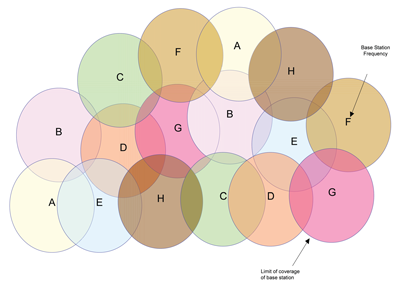
GSM-R is a cellular radio network like GSM which means that coverage is achieved by having a series of adjacent and overlapping small coverage areas or cells. The advantage of this type of network is that it allows radio coverage to be targeted to specific areas. In the case of a public cellular network, coverage is usually required across a geographical region resulting in a two-dimensional cell pattern (see Figure 1). Each base station channel or frequency is represented by a different letter. As the number of frequencies is a finite resource the pattern is reused in such a way that there is a separation distance between cells on the same frequency in order to avoid interference.
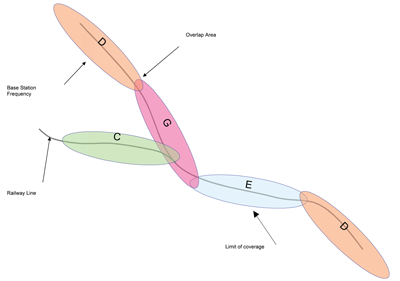
For a railway GSM-R network, the resulting cellular pattern is linear rather than two-dimensional (see Figure 2).
The rules for planning this type of network are different especially as GSM-R operators have considerably fewer frequencies to play with compared with a commercial operator. This is not too much of a hindrance, as railway GSM-R networks are generally linear in nature. In most parts of a railway network it is not possible for a radio site to see anything other than the two sites either side of it, however, the opposite is true in major conurbations where typically many railway lines converge into the centre meaning the frequency reuse pattern is very difficult to achieve as interference is possible between adjacent lines.
Key elements for successful GSM-R radio planning
From a radio propagation point of view, the railway environment requires specialist radio planning expertise in order to take into account features such as:
- Cuttings
- Embankments
- Tunnels
- Bridges (below and on top of)
- Bends in the track
- Railway stations
- Shunting areas
Public operators usually have the opportunity to cover difficult to reach areas by having radio sites firing in from different angles. Since the GSM-R network is linear in nature usually with radio sites located on railway land, it is particularly difficult to provide adequate coverage at all points along the line.
Railway operational constraints will also considerably affect how the radio plan is established. One of the principal applications of GSM-R is to provide secure communications that is always available between train drivers and controllers who are responsible for all train movements for one or more sections of line. GSM-R allows for location dependent addressing which means that train drivers do not need to know the telephone number of the controller who is responsible for a particular section of line. Calls are automatically routed to the relevant controller based on the cell of origin of the train initiated call. The advantage is that drivers just have to press one button irrespective of the location of the train and they will be put through to the relevant controller. In order for this to work, the radio cell boundaries need to closely line up with the controller boundaries.
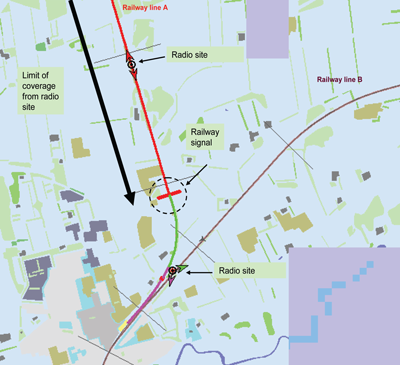
Figure 3 shows how the presence of a railway signal necessitates the careful planning of the radio cells so that a handover can take place between the two cells in the same area as the signal, ensuring that calls initiated by the train driver are routed correctly.
These constraints form part of the railway operating programme that needs to be defined by the railway operator before the radio planning can start. These and other inputs must be finalised before the planning process can start as any changes will have an impact on a number of radio sites. As a minimum, the inputs required are:
- The precise location of the railway lines and the boundary of railway land
- The precise location of existing structures that should be considered as potential GSM-R sites
- The precise location of all railway stations, tunnels, junctions, shunting areas, controller boundaries and nearby third-party railways
- The radio traffic capacity required at all points on the railway
- The line speed, direction and number of lines for each section of railway
- The definition of which lines will be fitted with ETCS (where appropriate)
- The geographical boundaries for railway emergency calls (a GSM-R railway emergency call that has been initiated will include all trains in a predefined area as well as the controller responsible for that section of line. To minimise the impact on railway performance these areas need to be carefully defined.)
The radio prediction tool used requires one or more propagation models and terrain and clutter databases in order to carry out calculations. For accurate predictions, it is essential that the model(s) used are calibrated for the railway environment. This involves running test trains along varying types of railway environment before the radio planning starts and taking on-board radio measurements from test transmitters located at key points on the railway. Once a sufficient number of samples have been taken, it is then possible to calibrate the model(s) by comparing what the planning tool predicts with the measurements. If a semi-deterministic model is used, there is little need to carry out measurements to validate the final radio plan. If an empirical model is used however, between 60% and 80% of sites need to be measured using test trains to ensure that the GSM-R will work once finally in operational service.
The choice of terrain and clutter map databases is also key to ensuring an efficient and accurate radio plan. There are two approaches: either use low resolution maps (which are relatively cheap) and include an additional radio margin in the planning process or, use high resolution maps (which are naturally more expensive) which means that no additional margins are necessary. By adding some ‘fat’ into the radio plan, it becomes conservative meaning that the prediction will show a worse result than in reality. In practical terms this may result in an increased number of radio sites compared to using high resolution maps. For GSM-R planning, 50m is considered low resolution and 5m high resolution. Figure 4 shows the two resolutions side-by-side.
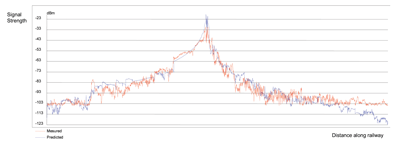
Figure 5 shows how accurate a semi-deterministic model can be when high resolution map data is used.
The graph in Figure 5 shows the variation of signal strength as a train travels along a railway line. As the train approaches the radio site the signal increases. The blue line indicates the predicted signal strength using a semi-deterministic model. The red line shows the actual measured signal strength received on board a test train. The two lines fit very closely. This level of confidence in the prediction means that far fewer validation measurements using test trains are required and results in a smaller margin between prediction using a probability of 50% and the required 90% result expected in railway environment. Since a 3 dB difference represents a factor of two in terms of power, this results in a much greater number of sites compared with an more accurate planning model.
Conclusion
Radio planning for GSM-R requires addressing carefully the level of Quality of Service per application and defining on a line-by-line basis the operational programme requirements prior to starting. Prediction tools must be flexible enough to benefit from the variable accuracy of databases according to specific topography of railway lines. Radio planning needs to allow the combining of specialist railway operational skills and propagation expertise in order for it to be cost-effective and accurate. Depending on the size and complexity of the railway, the largest element in the overall cost of a GSM-R network relates to the deployment of radio sites. An inefficient radio plan may result in a useable GSM-R system but could end up costing a lot more than originally planed. If done correctly, the approximately 1-5% of the overall project cost, which is typically spent on radio planning, is possibly the best form of cost control on a major GSM-R project.


Figure 1: 2-D cellular network


Figure 2: Linear GSM-R network


Figure 3: Lining up radio cell boundaries with controller boundaries


Figure 4: Comparison of database resolution (50m on left, 5m on right)


Figure 5: Comparison between predicted coverage (in blue) and measurements (in red)


