Corrugation and dip angle measurements performed by Eurailscout
Posted: 26 September 2007 | | No comments yet
Corrugation on rails causes severe damage to the railway infrastructure. Corrugation causes noise, additional stress in the rails and high frequency vibration which damages the subsoil; squats can also occur if rail head corrugation is not controlled.
Corrugation on rails causes severe damage to the railway infrastructure. Corrugation causes noise, additional stress in the rails and high frequency vibration which damages the subsoil; squats can also occur if rail head corrugation is not controlled.
Corrugation on rails causes severe damage to the railway infrastructure. Corrugation causes noise, additional stress in the rails and high frequency vibration which damages the subsoil; squats can also occur if rail head corrugation is not controlled.
Like rail head checking, corrugation can easily be cured by grinding at an early stage before any severe damage has developed. The best infrastructure maintenance strategy is to grind prior to the occurrence of severe corrugation; to achieve this accurate survey and measurement techniques are essential to reliably identify corrugation at an early stage. Hand equipment delivers results of high accuracy but is not suitable to make a general survey of the whole network and to date train borne inspection techniques have not been accurate or reliable enough to improve the maintenance strategy and a grinding programme, this has now changed: Eurailscout’s UFM 120 is equipped with the latest generation of corrugation measurement systems. A detailed measurement of corrugation can now be achieved with this highly accurate system at high speeds up to 120 kph (75 mph). The measurement is contact-less and almost independent of environmental circumstances. The advanced technology ensures that the measurement is always taken above the centre of the rail.
The technique used
Three lasers, positioned behind each other above the centre of the rail, measure the distance to the running surface of the rail. The distance between the first and the last laser (chord length) is about 150mm; a measurement is taken every 5mm; the versine can then be calculated from these measurements. In a further step the corrugation results can be derived from the raw measurement results.
Another laser based system measures the distance from the train’s bogie to the rail. This measurement is required to compensate the movement of the bogie and to ensure that the measurement is always taken at the centre of the rail. Without such an adjustment the measurements wouldn’t be repeatable or accurate.
Corrugation occurs in different wavelength areas. The shortest measurable wavelength is 15mm, the longest 1.000mm. With Eurailscout’s system it is possible to present the results in up to four wavelength bands in order to differentiate between the various kinds of corrugation.
Evaluation of the system and its results
To assess the quality of the corrugation measurement system various tests have been carried out:
Repeatability Analysis
For the repeatability analysis several runs with the same orientation of the vehicle, a similar speed and the same direction of travel are carried out. The measurement results of these runs are then compared against each other to identify the system’s ability to measure the corrugation repeatedly under the same circumstances.
Reproducibility Analysis
Again several comparison runs are completed, but with different speeds and changing orientation of the vehicle. The measurement results are then compared against each other to check the ability to deliver repeatable results under different circumstances. Of course this analysis is much more important for the railway operator than the repeatability analysis because he is interested in receiving the same results independent of the circumstances of the measurement.
Comparison with hand measurements
Once the system has proved its ability to reproduce the same results, comparisons with hand measurements are carried out. Due to the fact that hand measurement equipment works on a different principal these comparisons have been made with a qualitative approach. It could be proven that the system’s amplitudes correspond with the amplitudes found in the results of the hand equipment
Reproducibility of the results
One of the most impressive results of the evaluation was from the reproducibility analysis shown in Figure 1. The red coloured graphs represent the four runs with cabin one of the UFM 120 in front, whereby a higher speed of the recording is indicated by a darker colour. The blue lines show the results of the runs with cabin two in front. The scale is in 1/100mm. The whole scale represents 0.2mm only! 250 metres of measurement results are compared in this graph. Although the very little scale it looks like all lines are upon each other. In average the distance from one measurement to the other is less than 0.004mm. 95% of all results differ less than 0.01mm from the mean of the results from all runs, 98.8% of all values differ less than 0.02mm. Such a reliable and repeatable system allows surveying little changes on the network. Having several measurements over a decent time span allows forecasts into the future and enables the infrastructure operator to plan grinding works or any other suitable maintenance. The accuracy of the system is also suitable for assessing the success of grinding.
Quality assessment of isolation joints / dip angle survey
It is even possible to create other products with the raw data generated by the system. Due to the accuracy and the little distance between adjacent measurements of only 5mm a comprehensive survey of isolation joints is possible. Evaluation of the dip angle of joints is also possible. Eurailscout have carried out several tests to assess the quality of the survey data. The proven reliability and accuracy of the system allows evaluating the quality of joints properly. The Product Acceptance Process of the Dutch railway operator ProRail for the isolation joint assessment is currently going on. Once Product Acceptance is gained a survey of the complete network will be carried out to identify poor isolation joints. Once the defect joints are identified they can be repaired to overcome traffic disruptions caused by defect isolation joints.
Example of an isolation joint
The displayed joint in Figure 2 is of rather poor quality. What can be observed in the picture can also be measured. The measurement diagram displays one metre of rail, the amplitudes are in millimetres. As you can observe the straightness of the joint is not sufficient. At the gap there is a 1mm deviation downwards and 0.4mm upwards. The slope of the graph in Figure 3 gives information about the dip angle. The light blue graph displays the filtered results of the raw measurements (dark blue). The filtering allows better assessment without minor running surface defects. In comparison with acceleration measurements the survey performed by Eurailscout to assess the quality of joints is not speed dependent and much more reliable and repeatable.
It can be seen that the system is suitable to assess the quality of joints / isolation joints in a reliable and reproducible way. Thresholds can be defined to identify those joints that urgently need maintenance. Another threshold could be defined to put the attention to joints that need to be carefully observed.
Summary
Eurailscout’s new Corrugation Measurement System is a step change in train borne corrugation measurements. The system installed on the UFM 120 is able to give a network wide overview on corrugation problems. The excellent accuracy of the system and the high reproducibility of the results enable the desired evolution from reactive to proactive maintenance. The survey of the joints will help to prevent unplanned disruptions of rail traffic.
By surveying the majority of the railway network the most severe parts can be identified. The limited budget is spent to cure the sections with the worst damage. Repeated survey (e.g. twice a year) make the success of the grinding programme visible. New sections with corrugation can be identified and treated accordingly. Reliable measurement data combined with the experience of the infrastructure operator will lead to reduced life cycle costs and to a better railway.
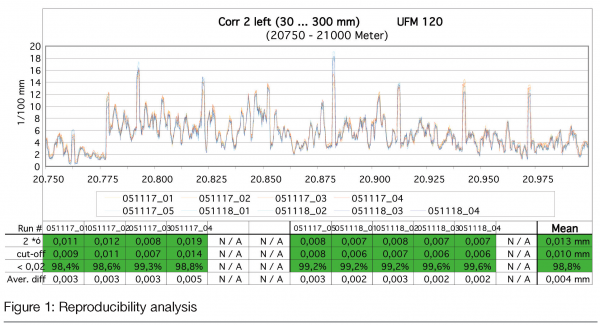

Figure 1: Reproductibility analysis
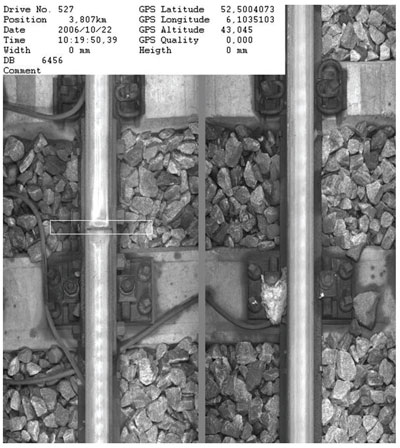

Figure 2: Assessed joint
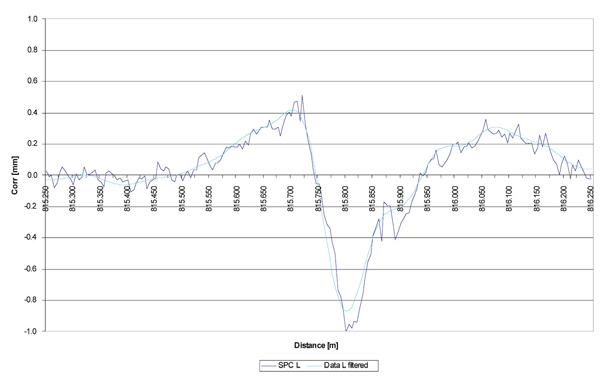

Figure 3: Graph of the measurement of an assessed joint
About the author
After completing his degree of civil engineering at RWTH Aachen, Germany, Dipl.-Ing. Dipl.-Wirtsch.-Ing. (FH) Steffen Knape started his career in the railway industry. His fields of special experience are slab track systems, life-cycle-cost calculations, measurement techniques around the railway infrastructure and rail infrastructure assessment. He joined Eurailscout in 2003 and became Director in 2005. He is among other things responsible for the technical developments within Eurailscout.
Stay Connected with Global Railway Review — Subscribe for Free!
Get exclusive access to the latest rail industry insights from Global Railway Review — all tailored to your interests.
✅ Expert-Led Webinars – Gain insights from global industry leaders
✅ Weekly News & Reports – Rail project updates, thought leadership, and exclusive interviews
✅ Partner Innovations – Discover cutting-edge rail technologies
✅ Print/Digital Magazine – Enjoy two in-depth issues per year, packed with expert content
Choose the updates that matter most to you. Sign up now to stay informed, inspired, and connected — all for free!
Thank you for being part of our community. Let’s keep shaping the future of rail together!


