The Internet of Things: Machine learning applied on MBTA commuter railroads
Posted: 18 June 2020 | Ryan Coholan | 4 comments
Ryan Coholan, Chief Railroad Officer at the Massachusetts Bay Transportation Authority (MBTA), discusses the benefits of introducing new technologies across the rail industry and how MBTA has successfully applied IoT to the maintenance of its locomotive fleets.


Credit: Massachusetts Bay Transportation Authority
When you mention the Internet of Things (IoT) to a seasoned railroad veteran, you expect to get an eye roll and a lot of suspicion in return. After all, we work in an industry that is traditionally slow to adopt any new form of technology, and why should we rush? After all, the basic function of railroads remains largely unchanged over the decades. As the adage goes, “if it isn’t broken, don’t fix it”. This was my mindset when I was first introduced to the theories supporting predictive analytics and any level of artificial intelligence (AI) deployed on railroads.
The MBTA was aggressively searching for new and innovative ways to forecast our fleet availability and lifecycle”
The Massachusetts Bay Transportation Authority’s (MBTA) Railroad Operations Directorate is charged with the management of the 5th largest commuter rail operation in the United States. Operating 500 trains per day on 14 different lines with a mixed fleet of over 100 diesel electric locomotives, the MBTA was aggressively searching for new and innovative ways to forecast our fleet availability and lifecycle, while also trying to understand how to best identify gaps that could introduce a risk to service delivery. With some of the fleet showing signs of aging (locomotives are between five and 30 years old), we were building a plan that would refresh the fleet over time. But, with the increasing demand for service not going away, it is imperative to use every available tool to help drive expectations and deliver the best possible service for our passengers.
The MBTA embarked on a pilot programme that utilised predictive analytics and coupled it to our locomotive fleet”
Fast forward to the spring of 2018, when the MBTA embarked on a pilot programme that utilised predictive analytics and coupled it to our locomotive fleet, harnessing one of the most basic elements of an internal combustion diesel locomotive – lubricating oil. When you examine the oil’s function, you can see that it acts as the ‘blood’ of the engine, as, without oil, the engine will not run. Oil sampling has been around for many years. We run oil-sampling metrics, and treat the data as a lagging indicator for engine health. This information is stored in a file and, traditionally, meets the end of its useful life. Oil reports historically look at individual elements like copper, iron, lead, tin, aluminium, calcium and sodium. There are high and low critical warning thresholds, but we look at them in their own ‘silos’. When we had a failure in the past, we would go back to the maintenance history and also pull the last oil sample, looking for out-of-range values. What we had to do was understand that the humble oil sample was actually a molecular ‘blackbox’ recorder that had a powerful story to tell, measured in parts per million (ppm).
Join our free webinar: Rail cyber-security in a time of technological and regulatory transformation
Join our expert panel, including speakers from Nokia and Siemens Mobility, to explore the critical convergence of cybersecurity and 5G rail comms.
Date: 3 Dec | Time: 15:00 GMT
Can’t attend live? No worries – register to receive the recording post-event.
We were able to see that this data could be used as a leading indicator, breaking the traditional cycle of oil sampling”
The MBTA made it a mission to put this data to work, over the long term, to actually monitor the internal health of our locomotive fleet through transfer learning. Our goal was to find the best of the best and identify units that are what we refer to as ‘high fliers’ and are at risk of failure or long-term damage in the next 30-60 days. Utilising predictive analytics built on OEM specifications, industry standards and ‘signatures’ from past failures, we were able to see that this data could be used as a leading indicator, breaking the traditional cycle of oil sampling. Once we strung together several samples per locomotive, we began to see the progressive health story behind each individual locomotive. Some locomotives were able present ‘symptoms’, similar to bloodwork for a person’s annual physical exam. We are able to look at the top leading symptoms and build simple work instructions to validate conditions and catch failures (like CCOP, fuel leaks, bearing wear and contamination) before they became an actual line of road failures. In our case, a line of road failure can present a scenario where we need to find alternative transportation for over 1,000 passengers per effected train and will then be forced to endure the ripple effect of delays that come with this.
This new process increased oil sampling frequencies across the fleet and standardised a process where an oil sample is drawn at 10-day intervals. Utilising our own in-house testing equipment, we dedicated time and personnel to streamlining the input and throughput in order to get us sample data at regular intervals. Once we started to lace together several samples worth of data in a chronological order, we could visualise the metrics and attach an actual rating to a locomotive.
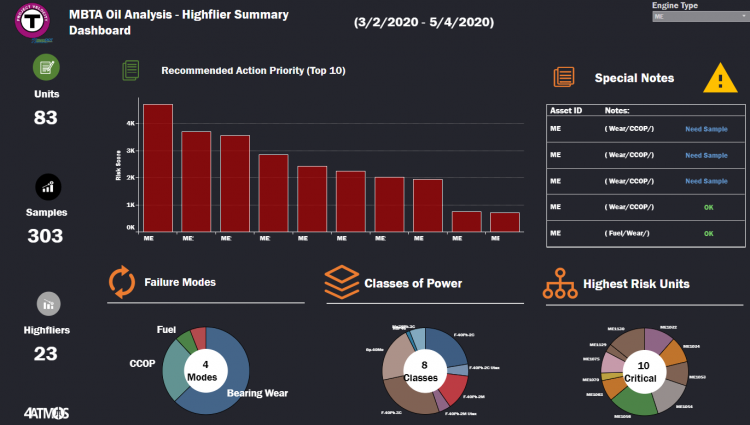

Credit: Massachusetts Bay Transportation Authority – MBTA Oil Analysis
As this progressed, we then started to closely watch line of road failures and what the oil data was showing prior to failure. From there, we could then match up different trends, or ‘agents’, across the locomotive fleets. By digging just a bit deeper, we could recognise probable failures based on oil sample data (where there are single or multiple issues), and then just how much longer we could expect that locomotive to keep running based on the strength of oil trend matches to other locomotives that have failed. From there, we are now in a position where we are able to rate each locomotive and take meaningful steps to prevent leaving a rush hour train (and a thousand or so of passengers) stranded on a single track mainline.
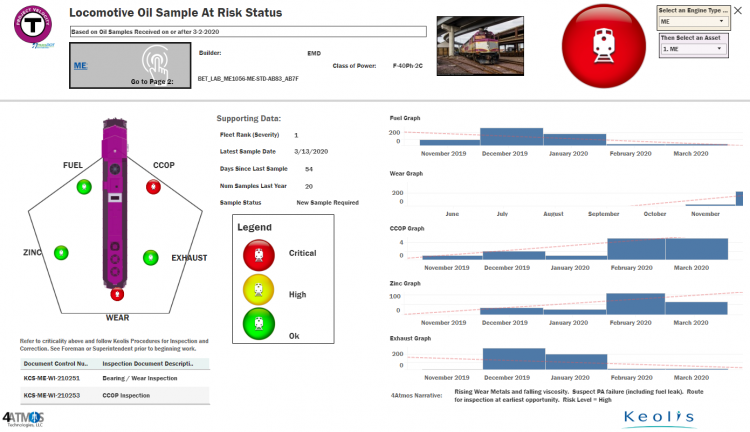

Credit: Massachusetts Bay Transportation Authority – MBTA Locomotive Oil Sample at Risk Status
This level of analytics was never possible on the MBTA’s previous railroad system. Manual processing and analysis of such a huge amount of data would consume our resources. By keeping an open mind and recognising the values that come with understanding IoT, we have been able to allow thousands of hours of analytics to run in the background, with the information that we capture in house. This new roadmap allows us to plan power usage in a manner that limits our overall risk exposure, but also acts as a leading indicator for future fleet planning and capital fleet replacement or overhaul.
Why has it taken the railroad industry so long to embrace, or even experiment with this? I do not know”
As the industry expands to adapt to this type of process, we need to look to our suppliers to answer the call. Unbelievably, predictive analytics has been around for many years in other industries. Why has it taken the railroad industry so long to embrace, or even experiment with this? I do not know. For MBTA, it took the established relationships that we have with trusted vendors and suppliers, as well as the willingness to let the data and analytics speak for themselves. Now, more than two years into our project (dubbed ‘Project Velocity’), we have seen the financial gains with catching a small engine issue before it turns into a catastrophic failure. We are helping to improve the trust that our passengers and stakeholders have in the system. This data has allowed us to move heavy overhaul programmes forward based on real data, which goes beyond the formerly-used educated guess.
Creating an integrated, single version of truth was critical. Our team needs to be able to have quick access to the data so that we can make evidence-based decisions quickly. It might be at our desk, on a tablet or mobile phone, but we can see the information anywhere.
Our in-house lab team processes samples in minutes or hours. In the past, we’d collect a sample, bag it, send it off to the lab and wait two to 10 days before the results came back. Now, we know in minutes or hours. A unit may be coming in for a scheduled 92-day service – we can draw a sample, send it up to the lab, and what comes back may be that the locomotive has an active fuel leak or water leak, or possibly both. When the repair is complete, we sample it again to confirm the results.
The implementation of predictive analytics, focused on IoT, has been a success story at MBTA”
The implementation of predictive analytics, focused on IoT, has been a success story at MBTA. This programme will survive for the long term and is now part of our long-term fleet planning strategy. Having the ability to see a problem before it becomes a bigger problem is such a powerful tool. We need to drive our suppliers to answer the call and respond to success stories, such as the MBTA’s Project Velocity, so that the industry as a whole can adopt new technologies into our fleets. Today, we are going beyond just main engine/ HEP engine oil. We also look at traction motor support bearing oil and coolant. Our end goal is to get the maximum number of useful years of life out of our fleet.


Global Railway Review Autumn/ Winter Issue 2025
Welcome to 2025’s Autumn/ Winter issue of Global Railway Review!
The dynamism of our sector has never been more apparent, driven by technological leaps, evolving societal demands, and an urgent global imperative for sustainable solutions.
>>> Read the issue in full now! <<<
Issue
Related topics
Big Data, Digitalisation, Internet of Things (IoT), Operational Performance, Rolling Stock Maintenance, Technology & Software




Congrats to Ryan and the MBTA team for letting the data take center stage! Oil truly is the lifeblood of any internal combustion engine, and when used as a leading, not trailing indicator of engine health, catastrophic risks can be mitigated.
Hi Ryan,
Have you considered vibration sensors for real-time feedback on bearings, gearboxes, etc? I work for KCF technologies. We install wireless sensors and remotely monitor equipment in real-time.
Ryan Coholan has created a world class oil analytics program at the MBTA that is globally unique in its scope, depth and use of molecular level AI. He’s a visionary leader that has built a team of subject matter experts who have visibility at the deepest level of engines, traction motors and coolant systems measured at parts per million. With weeks, not hours, of lead time they know long before an alarm goes off or can be visibly detected. Ryan will happily share his experiences with any railroad that wants to start an AI based oil analytics program at their rail operation.
What the MBTA is doing is on a scale that is best in class. Full 360 view of molecular risk across more than just oil. This is a solution that has an almost immediate payback and is a critical component to lifecycle management.