Partial productivity measurement in rail freight transport
Posted: 6 April 2011 | | No comments yet
Rail freight transportation in Europe is a challenging business, characterised by low margins and high fixed costs. In this context, an efficient and effective use of production resources, such as locomotives, freight wagons or engine drivers, is a fundamental requirement for the financial success of freight railways.
Rail freight transportation in Europe is a challenging business, characterised by low margins and high fixed costs. In this context, an efficient and effective use of production resources, such as locomotives, freight wagons or engine drivers, is a fundamental requirement for the financial success of freight railways.
Rail freight transportation in Europe is a challenging business, characterised by low margins and high fixed costs. In this context, an efficient and effective use of production resources, such as locomotives, freight wagons or engine drivers, is a fundamental requirement for the financial success of freight railways. This necessitates sophisticated productivity control. In this regard, in-house monitoring departments have to rely on a set of partial productivity indices that enables them to identify potential fields of improvement and to take appropriate action at an early stage. A major challenge is thereby the selection of relevant indicators that are both independent from each other and on the same aggregation level. For example, it is not evident whether ‘revenue per employee’, ‘cost per train-km’ and ‘net tonnes-km per train-km’ have to all be measured in order to monitor productivity comprehensively.
This article describes a practical-oriented conceptual framework that will help to develop, select and apply productivity indicators in a systematic way, thus addressing the problem of identifying independent and useful indicators. The framework predominantly addresses rail freight, but can easily be adapted for other transportation segments as well.
Characteristics of productivity
There are various ways how people consider and define productivity. Smith (1995)1 points out that each area, such as accounting, economics, and engineering has its own perception of productivity. Mostly though, productivity is defined as a relationship between the output of a production or service system and the input needed to create this output. In this article, productivity is regarded as ‘…the efficiency and effectiveness with which resources – personnel, machines, materials, facilities, capital, time – are utilised to produce a valuable output.” (Ranftl 1978)2. Numerous concepts have been developed over the years to distinct these two terms from each other. We will use the definitions of Hofer (1984)3 who describes effectiveness as “the degree to which the actual outputs of the system correspond to its desired outputs” and efficiency as “the ratio of actual outputs to actual inputs”. Drucker (1980)4 describes efficiency comprehensively as “doing things right” and effectiveness as “doing the right things”. In other words, efficient acting is doing something better which is already being done, while effectiveness is reached by providing the right services or products to market at the right time.
Eventually, it is important to make clear a difference between productivity and profitability. Profitability is consistently defined as the ratio of revenue and costs and therefore – in contrary to productivity – always non-dimensional.
Generic indicators
A great number of different partial productivity ratios for rail freight can be found in literature (e.g. Wiegmans 20075; Hilmola 20076; Christoph 20067; Oum 19998; Yu 20089 and Lan 200610). In rail freight transportation, typical input includes locomotives, freight wagons and employees. The output is the realisation of displacements, which is often expressed in train-km or net tonnes-km. Basically, each output factor can be combined with an input factor. This leads to a confusing variety of unstructured partial productivity indicators.
For a systematic approach, the above definitions of efficiency and effectiveness reveal a first important specification of the general term output as they distinguish between consumed (desired) output and actual output. This distinction is of little importance for most storable commodities, because the actual output can usually be stockpiled for consumption (Lan (2006))10. However, rail freight transport services are typically non-storable commodities, where a surplus of actual output at low demands cannot be stored for the use at high demands. This particularly applies for single wagonload services, where a regular train schedule is offered to customers. If customers consume the actual output (e.g. in terms of train-km) immediately, it is transformed in a consumed output (e.g. in terms of net tonnes-km). Otherwise, the actual output exhausts and is wasted.
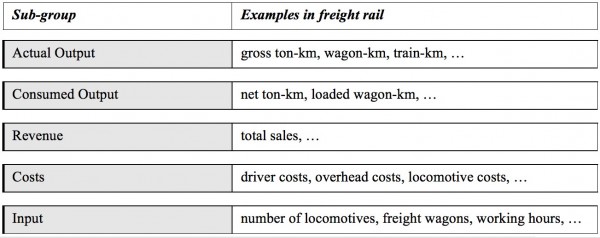
With regards to common productivity figures in both scientific literature and industry, the consumed output can be expressed with either performance or financial terms. The same applies for the input, which can be expressed with physical or financial figures. These considerations lead to a total of five subgroups of generic input and output factors. These are listed in Table 1, together with illustrative examples.


Generic input and output factors
This classification of generic input and output factors allows a systematic elaboration of partial (productivity) indicators. In a first step, each subgroup is combined with each others group in a logical sense. This generates 10 generic ratios:
1. Actual output / input
2. Costs / input
3. Costs / consumed output
4. Costs / actual output
5. Consumed output / input
6. Consumed output / actual output
7. Revenue / input
8. Revenue / consumed output
9. Revenue / actual output
10. Revenue / costs
Although not all of these ratios correspond with the definition of productivity in a narrow sense (such as revenue per consumed output), they might be of importance for explaining superior productivity indicators. However, Ratio 10 will not be considered, as it clearly corresponds to the definition of profitability.
Conceptual framework
In the following, the nine remaining generic ratios will be set in a hierarchical correspondence by means of finding mathematical correlations. The possibility of dedicating certain ratios to a single organisational unit is taken as a starting point. Such ratios are regarded as the foundations of more aggregated indicators and should therefore be identified first. Four of the nine ratios meet this criterion (1, 2, 6 and 8).
Ratio 1 is in the responsibility of the production department. It controls the main adjusting levers for the efficient employment of input to produce the target output. However, the production department has no control over whether the actual output is effectively consumed or not. This challenge belongs to business planning and controlling and is expressed in Ratio 6. This unit defines what is produced in which quantity on the basis of expected sales and customer requirements. The unit of business planning and controlling is therefore responsible for whether the actual product or offered network is consumed in the foreseen quantity or not.
The sales department has a different focus. Its main objective is to generate a maximum of revenue for each consumed output within the range defined by the unit of business planning and controlling. This goal is expressed in Ratio 8. This figure does not correspond with the basic definition of productivity, as no input resource is included. However, this ratio is a fundamental factor for partial-factor productivity indicators using revenue as output.
Ratio 2, the fourth independent ratio, is an indicator for unit costs. It clearly belongs to asset management (concerning rolling stock) and human resources (concerning employees). These organisational units control the main levers for influencing this ratio, such as defining the renewal, leasing or maintenance strategies for rolling stock and the salary policy for employees. Although Ratio 2 does not directly correspond with the basic definition of productivity, it is a fundamental factor for partial-factor productivity indicators using costs as input.
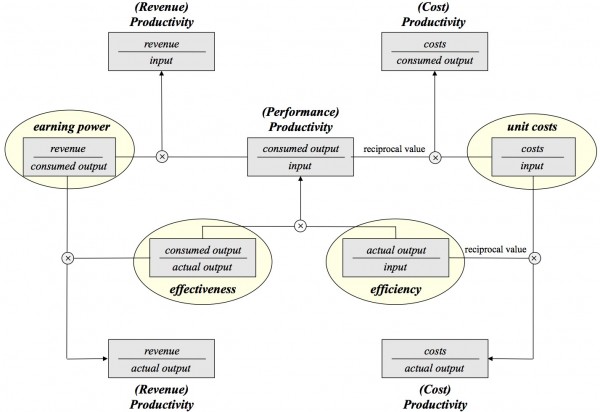
After having identified the four underlying independent indicators, they have to be put in coherence with the remaining ratios. As already stated in this article, effectiveness is regarded as “the degree to which the actual outputs of the system correspond to its desired outputs”. This corresponds to the elaborated Ratio 6. Furthermore, efficiency is “the ratio of actual output to actual input”, which is represented by the Ratio 1. Ranftl (1978)2 regards productivity as a combination of efficiency and effectiveness. This definition is taken into account by multiplying the corresponding Ratios 1 and 6. The result of this multiplication is Ratio 5, depicting productivity in a sense of performance. These dependencies represent the core structure of the conceptual framework.
The integration of the remaining ratios in the framework is being done analogically. Ratio 7 – revenue per input – depicts productivity by means of a financial output element. It is the mathematical product of Ratio 8 (earning power) with Ratio 5 (performance productivity). Ratio 9 is formed analogically by multiplying Ratio 8 (earning power) with Ratio 4 (effectiveness).
These dependencies are similar, when using costs as input element. Ratio 3 – costs per consumed output – depicts productivity by means of a financial input element. It is the reciprocal mathematical product of Ratio 2 (unit costs) with Ratio 5 (performance productivity). Analogically, Ratio 4 is the reciprocal mathematical product of Ratio 2 (unit costs) and Ratio 4 (efficiency).
The result is an intuitive graphical framework that systematically illustrates the interrelationships between the nine generic productivity ratios (see Figure 1).


Figure 1 Framework for structuring productivity indicators
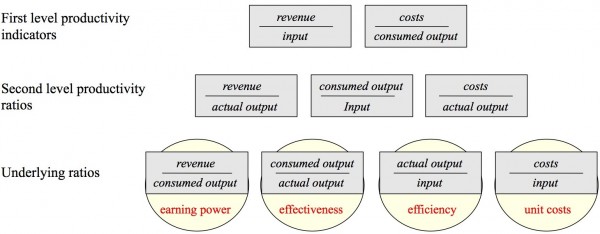
Based on this framework, the hierarchy of different productivity ratios can simply be deviated by counting the number of underlying indicators involved (see Figure 2). Ratios comprising three underlying indicators are classified as first-level productivity indicators. Likewise, second-level productivity indicators comprise two underlying indicators. The hierarchy thus created has a high relevance, because it allows the definition of adequate indicators for different target groups and purposes. First- and second-level ratios are helpful for getting an overall understanding of the company’s productivity situation. However, the responsibilities for such ratios are often unclear and appropriate measures are difficult to define. For that, the underlying indicators have to be considered that allow a better identification of the reasons and the responsible units of an insufficient productivity.


Hierarchy of productivity indicators
Application of the conceptual framework
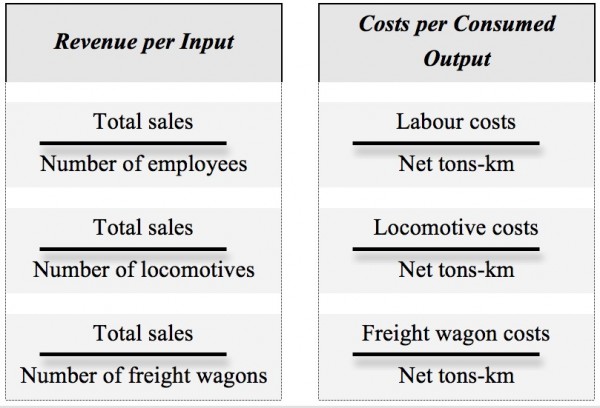
The elaborated generic framework and hierarchy for partial productivity has practical consequences for monitoring productivity. For instance, top management reports should concentrate on first-level productivity indicators, revenue per input and costs per consumed output. Table 2 shows a set of such first-level partial productivity indicators for freight railways. If these ratios meet the defined targets, no further action has to be undertaken. If one of these ratios turns out to be insufficient though, the underlying indicators have to be checked in order to identify the specific reasons and to define appropriate counteractions.


Table 2 Proposed first-level productivity ratios for freight rail
It has to be noted that the responsibility for first- and second-level productivity indicators is shared between several organisational units. Therefore, targets for productivity indicators should primarily be used for appropriately defining the underlying indicator targets. Only these can be clearly dedicated to a single organisational unit. The following imaginary example illustrates this approach:
Top management defined a target revenue of €1.5 million per locomotive (revenue per input). According to the elaborated framework, the target revenue of €1.5 million per locomotive is a product of the targets for revenue per consumed output (for example €0.03/net tonnes-km), consumed output per actual output (for example 500 net tonnes-km/train-km) and actual output per input (for example 100,000 train-km/locomotive). Those under – lying indicator targets can be dedicated to single organisational units and can therefore be appropriately applied to specific target agreements.
This example also shows the importance of a strict distinction between the different levels of productivity ratios in any management reports and tools. Otherwise, the user may come to a false conclusion by comparing ratios, which do not have the same significance or might be closely related to each other.
Overall, the elaborated framework enables a well-founded and efficient productivity monitoring with clear responsibilities. Five generic productivity ratios have been identified on two different aggregation levels. If the deducted specific indicators are in the range of the defined targets, no specific actions have to be undertaken. However, to find out the specific reasons and the responsible organisational units of an insufficient productivity, monitoring has to focus on the four fundamental underlying indicators: actual output per input (efficiency), consumed output per actual output (effectiveness), revenue per consumed output (earning power), and costs per input (unit costs). This is the foundation of target-oriented management.
References
1. Smith, E. A. (1995): ‘The Productivity Manual’, Gulf Publishing Company, Houston
2. Ranftl, R. (1978): ‘R&D Productivity’, Hughes Aircraft Company. Culver City
3. Hofer, C.W., and D. Schendel (1984): ‘Strategy Formulation: Analytical Concepts’, West Publishing Company, St Paul
4. Drucker, P.F. (1980): ‘Management: Tasks, Responsibilities, Practices’, Elsevier LTD, Oxford
5. Wiegmans, B., and A. Donders (2007): ‘Benchmarking European Rail Freight Transport Companies’, Transportation Journal, 2, 19-34
6. Hilmola, O.P. (2007): ‘European railway freight transportation and adaptation to demand decline – Efficiency and partial productivity analysis from period of 1980-2003’, International Journal of Productivity and Performance Measurement, 3, 205-225
7. Christoph J., Kühne T., and C. Schneider (2006): ‘Unternehmensführung im Schienengüterverkehr mit Kennzahlen’, Internationales Verkehrswesen, 4, 151-155
8. Oum, T.H., Waters, W.G., and C. Yu (1999): ‘A Survey of Productivity and Efficiency Measurement in Rail Transport’, Journal of Transport Economics and Policy, 1, 9-42
9. Yu, M.M. and E.T.J. Lin (2008): ‘Efficiency and effectiveness in railway performance using a multiactivity network DEA model’, Omega, 36, 1005-1017
10. Lan, L., and E.T.J. Lin (2006): ‘Performance Measurement for Railway Transport: Stochastic Distance Functions with Inefficiency and Ineffectiveness Effects’, Journal of Transport Economics and Policy, 3, 383-408
About the Authors
Ulrich Weidmann is Professor for Transportation Systems at the Institute for Transport Planning and Systems, ETH Zürich. Before he was appointed in 2004, he worked in different functions for the Swiss Federal Railways, finally as Head of the Business Unit ‘Railway System Engineering’ in the Infrastructure Division.
Stephan Moll studied Industrial Management and Manufacturing, ETH Zürich. Between 2005 and 2008, he worked as a Management Trainee and later as Production Controller for SBB Cargo. Since 2008, he has been a PhD Student at the Institute for Transport Planning and Systems at ETH Zürich with focus on freight railway operations and technologies.
Stay Connected with Global Railway Review — Subscribe for Free!
Get exclusive access to the latest rail industry insights from Global Railway Review — all tailored to your interests.
✅ Expert-Led Webinars – Gain insights from global industry leaders
✅ Weekly News & Reports – Rail project updates, thought leadership, and exclusive interviews
✅ Partner Innovations – Discover cutting-edge rail technologies
✅ Print/Digital Magazine – Enjoy two in-depth issues per year, packed with expert content
Choose the updates that matter most to you. Sign up now to stay informed, inspired, and connected — all for free!
Thank you for being part of our community. Let’s keep shaping the future of rail together!


