Innovative solutions to old problems
Posted: 3 November 2005 | | No comments yet
Railways are of great social importance. In The Netherlands, a million passengers take the train each day and an increasing amount of freight traffic also goes by rail. Without a safe and reliable network with sufficient capacity, everything would grind to a halt. It is one of the tasks of ProRail, which manages the Dutch network, to ensure that the rail infrastructure is adequate, reliable and safe.
Railways are of great social importance. In The Netherlands, a million passengers take the train each day and an increasing amount of freight traffic also goes by rail. Without a safe and reliable network with sufficient capacity, everything would grind to a halt. It is one of the tasks of ProRail, which manages the Dutch network, to ensure that the rail infrastructure is adequate, reliable and safe.
Railways are of great social importance. In The Netherlands, a million passengers take the train each day and an increasing amount of freight traffic also goes by rail. Without a safe and reliable network with sufficient capacity, everything would grind to a halt. It is one of the tasks of ProRail, which manages the Dutch network, to ensure that the rail infrastructure is adequate, reliable and safe.
Safeguarding the performance and quality of that infrastructure is a continuous process. The Dutch Government requires regular inspections of track and points to check that lines are safe and to make sure that environmental influences are not compromising the system. ProRail also makes time to inspect other components, such as overhead power lines and signals. Whether new or long-standing, the entire infrastructure will need maintenance or replacement eventually.
Quality
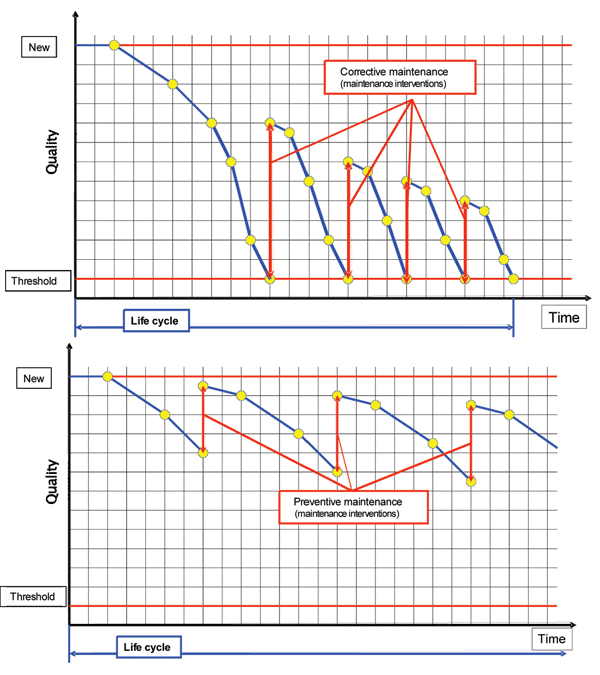
To make sure that its quality is not affected, there comes a time when the rail infrastructure has to be maintained. But when is the right time? Do you opt for shorter or longer periods between interventions? Corrective or preventive maintenance? And what degree of maintenance is preferable? (Figure 1)
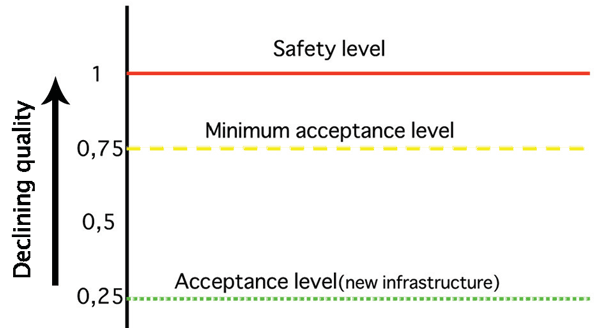
As quality declines naturally, various levels can be identified. New items start at an acceptance level. As time passes, their quality falls on a sliding scale towards the minimum acceptance level or even – if they are not maintained or replaced – to the safety level. (Figure 2)
ProRail manages and maintains the rail infrastructure based upon what is known as RAMS performance. This stands for ‘reliability’ (expressed in the number of faults during a given period), ‘availability’ (the proportion of time the rail infrastructure can be used), ‘maintainability’ (the amount of maintenance required during a given period) and ‘safety’ (the number of safety-critical faults during a given period). To ensure the performance and quality of the entire rail infrastructure, existing lines are tested against RAMS criteria. Within this process, the definition of upkeep specifications is an important aspect of RAMS management.
ProRail outsources infrastructure maintenance to process contractors. The upkeep specifications, which encompass specific norms, are key to this. The entire rail infrastructure in The Netherlands is subject to regular visual quality inspections, as well as checks using special trains equipped with measuring equipment. The process contractor reports on the state of the infrastructure and the actions it has taken. If the minimum acceptance level is reached for any reason, urgent repairs are carried out even though the situation is still far from safety-critical. ProRail’s upkeep instructions to the process contractor are that quality must never fall below the minimum acceptance level so that there is never any question of the safety level being reached.
ProRail is also responsible for the total cost of ownership and the long-term availability of the rail infrastructure. Using lifecycle management (LCM), the various approaches to a project can be weighed up deliberately. Aspects which play a part in this are the investment and maintenance costs, the disruption to customers during the work and the use of the item being maintained. LCM ensures that lifetime costs are optimised, taking into consideration a set quality target. The ultimate aim is that the ideal balance be struck between continuing maintenance and replacement. Introduction of the LCM system leads to savings in the long term. ProRail is therefore striving to apply LCM as widely as possible. With a view to lifetime costs, it is essential to understand and be able to demonstrate quality.
However, it is not just ProRail itself which has an interest in achieving transparency with regard to the quality of the rail infrastructure. Other parties also attach great importance to this factor. For the national government and society at large, demonstrable quality provides a benchmark for safety and a reference point for responsible spending. For the train operators, improved quality means that their wishes in terms of safety and comfort are more likely to be met. The higher the quality of infrastructure means the higher the quality of traffic using it. Demonstrable quality is also relevant to the construction and maintenance of rail infrastructure, since it means that contractors can be managed on the basis of quality and transparent results agreements. By making the quality of the work demonstrable, ProRail can profile itself as one of Europe’s most professional rail infrastructure managers.
Track geometry
For ProRail, then, it is vital that the acceptable life of the rail infrastructure in terms of quality and the extent of necessary maintenance and replacement be measurable. With a good system in place, all the relevant requirements can be translated into measurable units. This demands both professionalism and scientific rigour. As well as video observation and inspections of the catenary geometry, track geometry and track environment, vegetation checks, georadar surveys and ultrasonic and eddy-current measurements are carried out. To determine the quality of the track geometry, the following parameters are measured and recorded: track gauge, longitudinal level, alignment, cant and twist.
However, the current standards for track geometry are controversial. There is a major discrepancy between the statutory norms and those actually used in practice. There is no good, consistent evaluation method at the European level and the ways usually used to assess track geometry are subjective. All this has a negative impact on RAMS and LCM. Moreover, the usual assessment methods do not relate the quality of track geometry with safety and comfort – in other words, traffic quality – despite the fact that there clearly is a link between these factors!
Project
It was with that in mind that a project was initiated in 2002. Its aim was to develop improved standards and a better method for assessing the quality of track geometry. Led by ProRail, an alliance was formed with the Strukton Group, NedTrain and AEA Technology Rail. Knowledge and assistance were also enlisted from other groups and bodies, including The Netherlands Transport and Water Management Inspectorate (IVW), Delft University of Technology, the ProRail regions and contractors. In carrying out the project, the latest European regulations were implemented.
The project made use of the UFM 120, a multipurpose measurement and inspection vehicle for rail infrastructure which can travel at the speed of an ordinary train and so work without disrupting the normal timetable. The vehicle has been designed especially for use on the European standard gauge. Amongst other things, it can measure important quality data pertaining to track geometry with great accuracy. Rail defects and other problems are also recorded and reported. To achieve this, the vehicle is equipped with the very latest measurement and computer technology. All measurements are carried out without physical contact and so do not affect the line’s technical systems. The results are calculated against a common reference point. Thanks to precise D-GPS positioning, the measurement points are located precisely. All results are stored in digital form.
As part of the project, an advanced, software-based assessment method called Pupil was developed. Using innovative calculation models, the software translates vehicle characteristics into fast and compact evaluation filters for the track. These are based upon the criteria for forces and acceleration derived from UIC fiche 5181. All the measurement data are stored in IRISsys, a large database with extensive analytical capabilities. That data is used subsequently to evaluate vehicle response, maintenance and geometrical parameters.
Assessment method
The innovative Pupil method makes it possible to assess, in accordance with the European standards, the forces and accelerations which result from combined and harmonic deviations. The assessment method is based on recently developed calculation models and presents the results in a user-friendly way. The advanced measurement method allows the position of the track to be monitored and to be evaluated quantitatively.
A practical example will show how all this works.
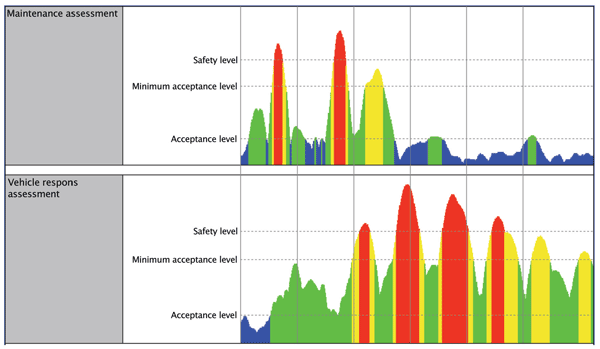
In figure 3, the horizontal axis represents part of a journey. The broken horizontal lines indicate the various quality levels; that is, the comfort and safety of the vehicle as expressed in its response data. At the beginning of the journey, the response is within the permitted quality standards. However, the graph also shows that – at this specific speed – the safety level is reached and even exceeded at several points later in the journey.
If we now compare the vehicle-response assessment with the maintenance assessment of the track geometry, we see that the latter peaks just before the former (see figure 4). It is thus clear that the minimum acceptance safety levels are being exceeded and that this affects the vehicle response.
Following analysis of the associated geometrical parameters – track height, cant difference, lateral track displacement and so on – an overall assessment can be reached based on all factors.
This method enables us to make objective, quantified statements about the relationship between the quality of track geometry and the vehicle’s responses at various speeds. Consequently, it has also become possible objectively and quantitatively to verify track geometry standards based on the analysis of vehicles responses. This innovative assessment method has a direct practical application, too. The safety of traffic using the rail infrastructure depends on its velocity, so speed restrictions may be a sensible temporary solution if the safety level is exceeded.
Success
The project was completed successfully in 2004. The result is an innovative, high-tech assessment tool incorporating the latest European CEN and UIC rules. ProRail now possesses a unique and powerful instrument for the quantifiable measurement of track quality, thanks to which it can monitor that track’s lifecycle and manage its maintenance as effectively as possible (RAMS), as well as spending upkeep budgets responsibly (LCM). Moreover, speed-related vehicle-response analysis provides an immediate and practical safety solution as well as a sound basis for the standards and the familiar flaws.
The project’s success was due largely to the broad support it received from those involved – including governments, train operators and contractors – which in turn was thanks in part to its practical applicability and its positive impact upon RAMS and LCM. The first steps towards implementation were taken earlier this year, and the system will be in use throughout the Netherlands in 2006.
By no means does this imply that the project is at an end, though. The first follow-up phases are already underway. Development of the assessment method continues, to ensure even better control. Eventually, it may even be possible to carry out continual measurements using equipment on multiple vehicles. In addition, more research into passenger comfort is needed. In other words, there is plenty of fertile ground for further developments.


Figure 1: Comparison graph from corrective and preventive maintenance


Figure 2: The quality sliding scale


Figure 3: Vehicle response assessment graph indicating the various quality levels


Figure 4: Comparing the maintenance assessment and the vehicle response assessment
Reference
- UIC fiche 518, 2nd edition, 01/04/1999: Test and acceptance of railway vehicles from the point of view of dynamic behaviour, safety, track fatigue and quality of ride.
Stay Connected with Global Railway Review — Subscribe for Free!
Get exclusive access to the latest rail industry insights from Global Railway Review — all tailored to your interests.
✅ Expert-Led Webinars – Gain insights from global industry leaders
✅ Weekly News & Reports – Rail project updates, thought leadership, and exclusive interviews
✅ Partner Innovations – Discover cutting-edge rail technologies
✅ Print/Digital Magazine – Enjoy two in-depth issues per year, packed with expert content
Choose the updates that matter most to you. Sign up now to stay informed, inspired, and connected — all for free!
Thank you for being part of our community. Let’s keep shaping the future of rail together!


