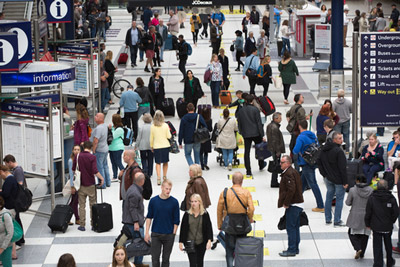
London railway stations most heavily used in Britain
Posted: 15 December 2015 | | 1 comment
Annual station usage data published by the Office of Rail and Road (ORR) reveals London railway stations are the most heavily used in Britain. Results of data published on 15 December 2015 reveal the total number of entries and exist at stations across Britain between April 2014 and March 2015 rose by 112 million or […]


Annual station usage data published by the Office of Rail and Road (ORR) reveals London railway stations are the most heavily used in Britain.


Results of data published on 15 December 2015 reveal the total number of entries and exist at stations across Britain between April 2014 and March 2015 rose by 112 million or 4.5 percent compared to the previous year. Figures also reveal, nine of the top ten heavily used stations were located in London, including London Waterloo which remains the most used station in Britain recording over 99 million passenger entries, up 0.7 million or 1 percent compared to 2013-14.
Nine London railway stations rank in the top ten most used in Britain
In addition, passenger entries and exits at London’s Stratford Station rose 17.4 percent to 30 million compared to the previous year. The station is now the tenth busiest in the country. Birmingham New Street was the only station outside of London to enter the top ten with over 35 million passenger entries and exits in 2014-15.
Commenting on the figures, a spokesman for the Rail Delivery Group said: “These figures underline the increasingly important role the railway is playing in the day-to-day lives of millions of people as passenger numbers continue to grow at many of the country’s 2,500 stations.
“It’s no surprise that where passengers are benefiting from better facilities, such as at Birmingham New Street and Stratford, there have been huge increases in people wanting to use them. Growth at even the smallest stations is proof that when the rail industry works together to improve facilities, passengers vote with their feet.”
Top 10 most used stations in England, Scotland and Wales based on estimated entries and exits for 2014-15:
|
Station |
2014-15 entries & exits
|
2013-14 entries & exits
|
% change
|
GB rank 2013-14
|
|
Waterloo |
99,201,604 |
98,442,742 |
0.8% |
1 |
|
Victoria |
85,337,996 |
81,356,330 |
4.9% |
2 |
|
Liverpool Street |
63,631,246 |
63,004,002 |
1.0% |
3 |
|
London Bridge |
49,517,854 |
56,442,044 |
-12.3% |
4 |
|
Charing Cross |
42,978,890 |
40,170,074 |
7.0% |
6 |
|
Euston |
42,952,298 |
41,911,706 |
2.5% |
5 |
|
Paddington |
35,724,684 |
35,093,628 |
1.8% |
7 |
|
Birmingham New Street |
35,312,788 |
34,748,984 |
1.6% |
8 |
|
King’s Cross |
31,346,862 |
29,833,456 |
5.1% |
9 |
|
Stratford |
30,974,204 |
26,377,506 |
17.4% |
12 |
The full ORR station usage dataset report can be viewed here.


Wonder how those compare with the rest of the EU